
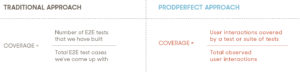
Traditionally, test coverage has been a difficult metric for QA/Engineering/Product teams to track. It often consists of teams coming up with all of the scenarios they would like end-to-end (E2E) tests built for, and then dividing the number of tests they have created by the number of total tests they want to automate. This coverage number then changes as new test flows are determined and added.
While this is a great metric for teams to track progress internally, there are missing pieces of information and challenges with tracking test coverage this way:
- How does the team know that the tests they have come up with are the most important ones? More specifically: are the automated test scenarios both customer-impacting and revenue-impacting?
- How does the team achieve adequate coverage while still maintaining an efficient testing process? Over time, test suites continue to bloat and become flaky, and organizations are forced to reserve test runs for overnight or on weekends, which does not align with continuous testing/CI best practices.
ProdPerfect’s Data-Driven Approach to Test Coverage
Instead of measuring coverage from the raw number of tests created, ProdPerfect looks at what percentage of total user behavior each test covers. We build test cases by discovering patterns in your application’s usage data and calculate coverage simply by dividing what behavior our tests cover by total observed behavior.
Cumulatively, when a test suite is delivered to our customers it must cover a minimum 65% of total user behavior, no matter the number of tests. This is important because:
- Our customers have confidence that every time they run our test suite, it is covering the scenarios that are truly important to their users—those interactions that are most frequent. This allows our test suite to reach very high coverage with very low runtimes and instability.
- Ongoing, our engine continuously analyzes an application’s clickstream data, identifying key changes in behavior that impact existing workflows in the test suite, as well as new areas of the application that the development team deploys and users deem important.
- As an application expands and evolves, the set of behaviors to reach 65% will change as well. ProdPerfect continuously compares the current test suite against the current behaviors of users, and then adds and modifies tests to maintain 65% coverage.
A Customer Example
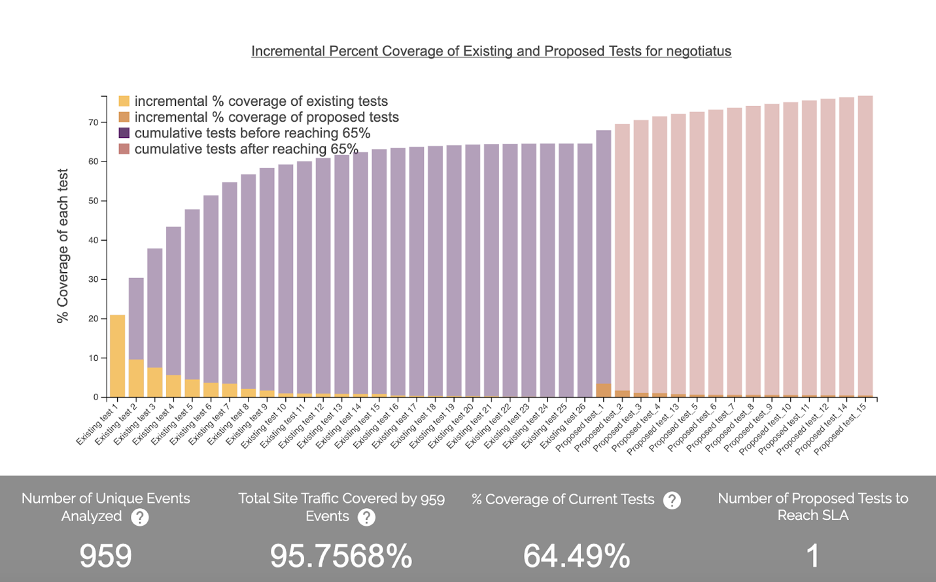
The graph above shows a ProdPerfect customer’s current test suite consisting of 26 E2E test flows.
- When looking at test 1, we see that it covers a whopping 21% of all user behavior observed (not surprisingly, this is their standard shopping/checkout flow). Test 2 covers 9% of all user behavior. Cumulatively, these two tests cover 30% of all user behavior observed in the application.
- Each test beyond the first will contribute less incremental coverage; cumulatively those 25 tests account for 65% of all user behavior observed in that analysis run.
- During this analysis run, we see that new behavior has been introduced, causing test coverage to drop just below 65%. This was due to a new feature being released to production.
- In order to get back above 65% coverage, proposed test 1 will need to be added into the test suite.
- These analyses occur every hour, 24 hours a day, 7 days a week to ensure that coverage is rapidly updated.